Among the first priorities for most service based organizations is employee performance reporting. And with good reason, in the service world, our technicians, engineers and workers are our product. The first point of understanding of the ServMan approach to coaching employee performance starts with a initial delimiter, is the employee in a department that is Job or Order focused. You need to understand this fundamental difference before you start searching for how you will select and monitor your KPI's. Job based departments have a lead technician assigned to a Job record that can have many orders, each order with it's own purpose and perhaps various helpers and other resources assigned. Jobs have estimates, and can span an extended period of time. You need to look at the job as a whole to determine how a Job performs, for an Order based department, you view it order by order. Examples of Job based departments would typically be your installation department, your service department would be an example of an Order based department.
Understanding this difference you can clearly see that the KPI's you use for your service department simply wont work for your Installation department, but then you already knew this didn't you. Because organizations often have employees move from department to department we wanted to latch onto a KPI concept that would carry across all groups. Something that allows us to coach a concept that holds true regardless of the department a technician worked in. We choose Billable Efficiency.
The Billable Efficiency concept is not new, and with a minimum amount of effort is easily reported and calculated. In essence the formula works like this. Simplified, look at your gross project before labor cost and divide this by a revenue per hour goal. This gives you a "Billed Hours" equivalent. Divide this by the actual time it took to earn this money and you have Billable Efficiency. If your a Job based department, you look at all time, cost and revenue applied to the Job. If your reviewing an Order based department, you simply look at time, cost and revenue applied to the Order.
As you more closely examine the reports you'll come to find that as simple as it's been stated above, the software provides you numerous options for "affecting" this value. For example, on Job based departments you can assign an efficiency factor to an employee, like a helper. Using this approach his time will be adjusted for his reduced cost or ability to contribute to our Lead Technicians performance. Call backs can affect billable efficiency, and more. Now lets take a look at the actual reports them selves.
The Technician Performance Report is for monitoring and coaching the Billable Efficiency for both order or job based technicians. The report is designed to support both flat rate and non-flat rate organizations. It is run based on the employee HOME department, as set on the employee's set up screen. And, it should be run for a specific date range, most often weekly or monthly. Highly informative it is comprised of seven distinct sections. Read the descriptions for each below making sure to fully understand its "goal". Then, manage your company's workflow to "feed" the report.
NOTE: IMAGE MAY NOT INCLUDE THE CURRENT RELEASE OF THE REPORT.

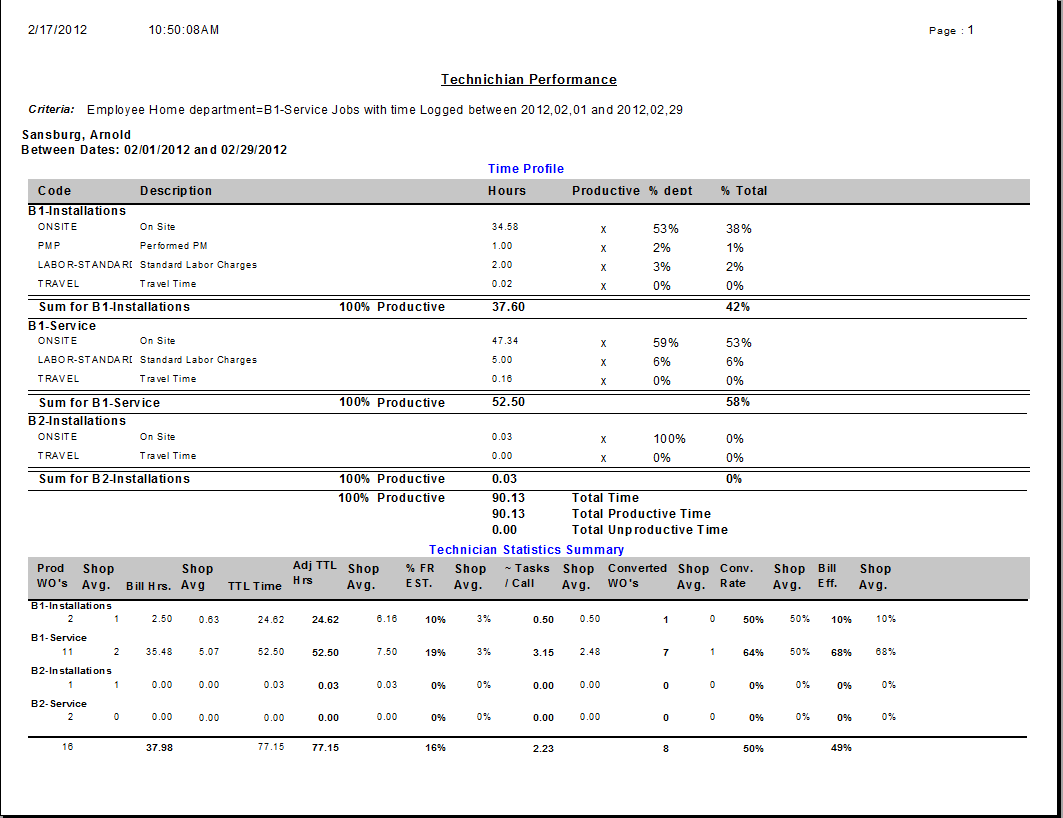
The Time Profile provides a summary of all time logged to the employee for the date range entered on the report setup screen. Time is reported by department and categorized as either productive or unproductive. Certain time codes can also be flagged as "General & Administrative" in type. (On the labor item setup screen). Choosing the report option to "Distribute G&A" causes all time logged to these item codes to be allocated departmentally based on the percentage of time an employee spent working in each department.
Running the report without the "Distribute G&A" option checked and no G&A adjustment will be noted. All time will appear in the department to which it was logged.
Looking at the first line of the totals section for the time summary, we can see the employees percentage of productive time, and total hours logged. The second and third lines include both total productive and unproductive hours. Remember, all time is logged using an item code. You must properly configure the item codes used for time logging. Review labor item setup for additional detail.
What time you classify as Productive or Non-productive is up to you, same with G&A. Establish your base lines and review with your employees where they are spending their time and how they can reduce their non-productive time. If you can set a goal as to what an acceptable value is, communicate this clearly to your personnel and then make them accountable when they exceed your limits. You will quickly discover if your limits are realistic and in doing so will a little more about your company.
The second section titled "Technician Statistics Summary"provides a summary overview of all work orders completed by this technician within the selected date range, comparing their performance to the shop average departmentally.
All work orders assigned to the technician where they are set as "lead" and completed within the selected date range are included in the first column under department listed on the order. The second column shows the shop average for all technicians. This concept is repeated for all columns across the page. All orders completed in Departments flagged as "Service", (order based), will be grouped separately from those flagged as "Job" based. If Job based, only Jobs that have been completed within the date range will be included for the Technician listed as Lead on the Job Record. Departments are set as Job or Service based on the Department setup Dashboard tab.
In the Service Departments section of the report the Billed Hours section is based on one of two factors based on how the report is run. If you are a Flat Rate shop for ALL items you can use the Flat rate estimated hours to determine billed hours, if you are a time an materials shop you may use the RPH, (Revenue Per Hour) method. The RPH method supports the ability to commingle certain flagged flat-rate codes for services such as warranty service and maintenance agreement visits. You can optionally choose which algorithm is applied when running the report.
IF Using the Flat-rate method. Billed Hours is based on the HOURS allocated to the Flat-rate task, set on the flat rate item setup screen, Plus the quantity field for Items with a type of LABOR that have a non-zero sales amount associated with them.
IF RPH method, Billed Hours will be calculated based on the following formula:
GROSS SALE - Materials (Optionally with Burden) / RPH Goal + Flagged Flat Rate items.
The RPH goal is set on the Department setup screen with the Dashboard settings. Flagged Flat Rate items refers to the ability to force the software to use the Flat Rate estimated man hours from the item for Billed Hours. This is used to provide credit to a technician for non-billable services such as warranty work or maintenance visits. Items must be specifically flagged on the on item setup screen to be included in this calculation.
In the Job Departments section of the report the Billed Hours is based on the following formula:
Net Profit before Labor/Departmental Revenue Per Hour Goal, RPH plus flagged Flat Rate Items.
The total time column shows us the actual time logged to complete this work. If order based, all time logged to the order, if Job based, all time logged to the Job. This brings us to the Adjusted total hours. The software provides an adjustment to the employees total time logged based several factors including call backs charged against them, as well as those run by them, charged to other technicians. Time spent working on other technicians call backs is subtracted, and conversely, time other technicians spent working on this employees call backs is added, adjusting overall billable efficiency. For Job based departments there is one additional feature. The software allows you to set an employee efficiency factor on their record. Factors are set as percentages ranging to 100%. This percentage is applied to their logged time and used under the adjusted time column. It's purpose is to allow you to reduce the efficiency factor of helpers or lessor skilled apprentice workers while they hone their skills. By doing this, you are not penalizing your team leader for having lessor skilled individuals on their jobs.

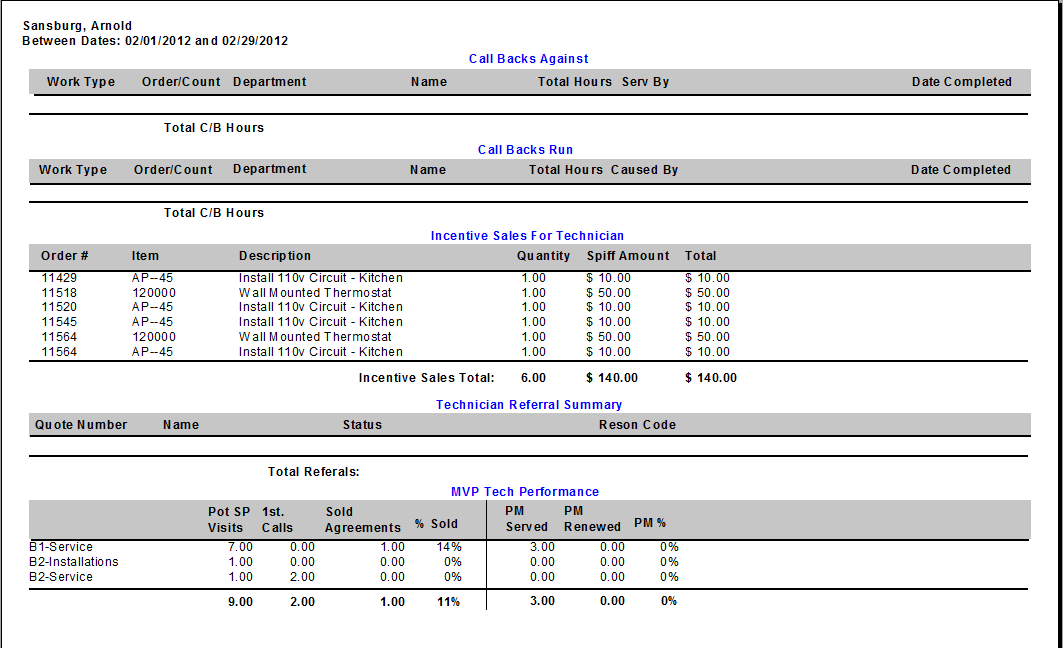
If Call Backs are completed within the selected date range where this technician was listed as Lead on the order or Job will be included in the Call Backs Against section. If optioned on the opening screen, hours logged by other technicians will affect this technicians efficiency rating.
All Call backs completed BY this technician charged to OTHER technicians will be listed under the Call Backs Run section and this time will be subtracted from their total time logged so as to NOT affect their billable efficiency.
Technician Referral Summary
Displays all Quotes entered into the system within the selected date range where this technician is listed as the referral source.
The final section of the report includes statistics on the performance and sale of Maintenance Agreements. Potential SP Visits are where work was performed for first time clients or clients that do NOT have a current PM Agreement. Next are first time clients followed by agreements sold and performed by this technician.